Maintenance Planning
Scada3k includes a built-in maintenance planning system to help you keep track of recurring tasks for your machines.
Overview
The system consists of two main components:
- Maintenance Definitions: These define what needs to be done and how often.
- Tasks: These are the specific instances of a maintenance job scheduled for a particular date.
Setting Up Maintenance
Maintenance schedules are configured in the Administration panel.
- Go to the Admin Panel.
- Navigate to Machines and select the machine you want to configure.
- Scroll down to the Maintenance section.
- Add a new maintenance definition:
- Name: A descriptive name (e.g., "Weekly Lubrication").
- Start Date: The date when the first maintenance should occur.
- Interval: How often the task repeats (e.g.,
7 days). - Create Task Before: How far in advance the system should generate the specific task (e.g.,
1 day).
The system checks every minute and creates the next due task once the current time reaches its scheduled date minus Create Task Before.
Machine Errors (Alarms)
Besides scheduled maintenance, Tasks can also be generated automatically from machine alarms.
Alarms are configured in Admin Panel → Machine Errors, and watch a Node's value to detect when the machine is in a fault state:
- Code / Name: A numeric error code and a human-readable name for the alarm.
- Node / Activation Value: The node that carries the fault, and the value that means "this error is active".
- Severity: A priority level, managed under Admin Panel → Severities (e.g.
P1= critical). Severity determines the alarm's color on the dashboard — see Machine Status in the Dashboard Guide. - Auto Create Task / Auto Close Task: If enabled, a Task is automatically created the moment the error becomes active, and/or automatically marked DONE the moment it clears.
- Task Note / Task Note Editable: A default note applied to auto-created tasks, and whether operators may edit that note on the dashboard.
Every time an alarm activates or clears, the system records an Error Event with its start and end time. Error Events drive the alarm history and the statistics (event counts, top errors, tasks resolved within 24h) shown on the Management Dashboard.
Managing Tasks
Operators can view and manage tasks directly from the main Dashboard.
Viewing Tasks
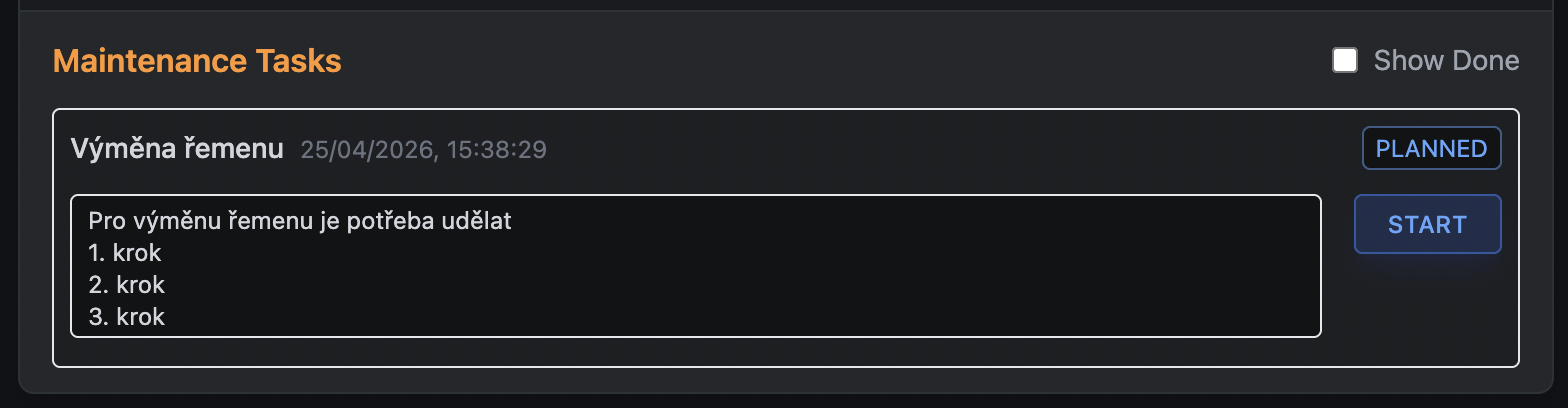
- Tasks appear in the Maintenance Tasks section under each machine card.
- By default, only CREATED and IN_PROGRESS tasks are shown.
- Check the Show Done box to view completed history.
Task Lifecycle
Tasks move through three states, shown as a colored badge on the dashboard:
- CREATED: The task exists and is waiting to be started. Scheduled-maintenance tasks appear once their lead time is reached; alarm tasks appear the moment the alarm activates (if Auto Create Task is enabled).
- IN_PROGRESS: An operator has started working on the task.
- DONE: The task has been completed — either manually by an operator, or automatically when its source alarm clears (if Auto Close Task is enabled).
Notes
Each task has a single note field that operators can edit to record observations or details about the work performed. The note is saved automatically and remains in the task's history. Editing can be disabled per Maintenance or Machine Error definition (Task Note Editable); if disabled, operators can still see the note but not change it.
Task Log
In addition to the single note, every task keeps a running, timestamped log:
- Click Show log on a task to expand its history.
- Type a message and press
Enteror click Add to append it. Each entry records the time and, if you're logged in, your email. - Unlike the note, log messages can't be edited or removed once added, and adding one doesn't require being logged in.
Use the log for a play-by-play of what was tried and observed, and the note for the current summary or status.