Dashboard-Handbuch
Das Scada3k-Dashboard bietet einen Echtzeit-Überblick über alle angeschlossenen Maschinen und deren Datenpunkte (Nodes).
TV Dashboard
Dieses spezielles TV Dashboard ist für große Bildschirme (z.B. in Werkshallen) konzipiert, um einen gut sichtbaren Überblick über den Maschinenstatus zu bieten.
Hauptmerkmale des TV Dashboards:
- Nur Lesen: Das TV Dashboard dient ausschließlich der Überwachung. Es erlaubt keine Steuerungs- oder Eingabeoperationen.
- Automatische Aktualisierung: Die Daten werden kontinuierlich aktualisiert, ohne dass die Seite neu geladen werden muss.
- Panic Mode: Wenn eine Maschine einen Fehler meldet (über den konfigurierten
error_node), blinkt die gesamte Maschinenkarte rot, ein Symbol für einen kritischen Fehler wird angezeigt und die Fehlermeldung nimmt die gesamte Karte ein, damit sie sofort bemerkt wird. - Warnungen: Wenn eine Maschine eine Warnung meldet (über den konfigurierten
warning_node), erscheint oben auf der Maschinenkarte ein orangefarbenes Banner mit dem Namen der Warnung. - Dynamische Textgröße: Die Werte der Nodes werden automatisch skaliert, um den verfügbaren Platz effektiv zu nutzen.
- Anpassbare Farben: Sie können für jeden Node eine spezifische Textfarbe festlegen (über
tv_dashboard_text_colorin der Node-Verwaltung), um wichtige Metriken hervorzuheben.
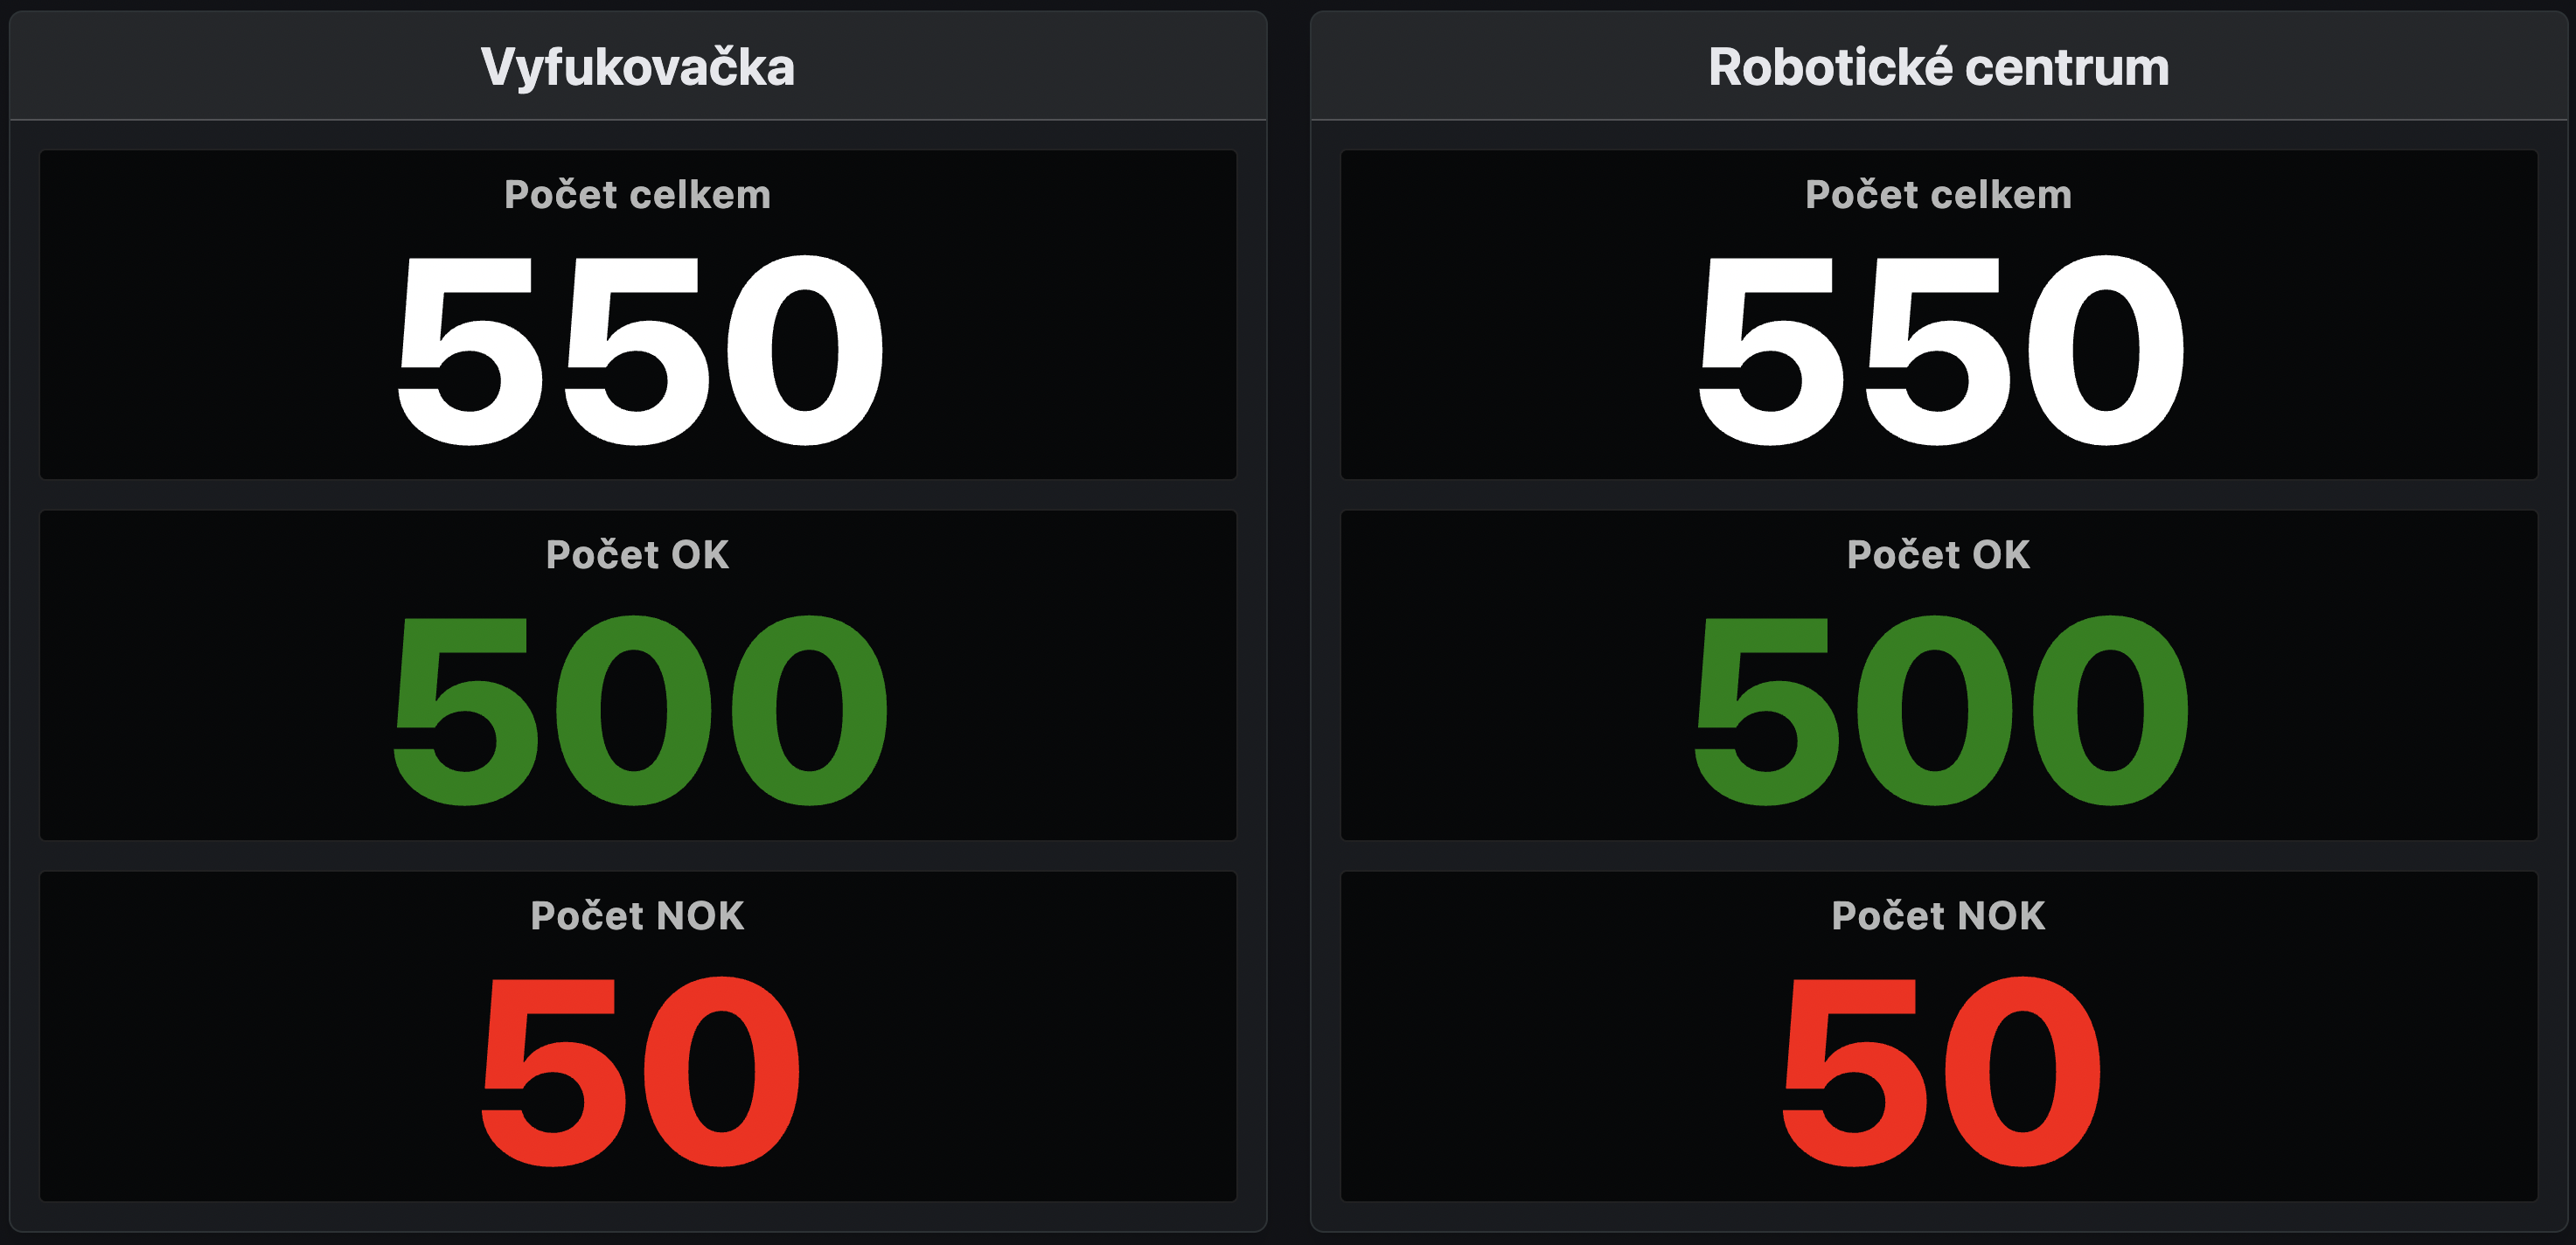
(Der Rest des Inhalts ist vorerst auf Englisch)
Interface Overview
The dashboard is organized into cards, where each card represents a single machine.
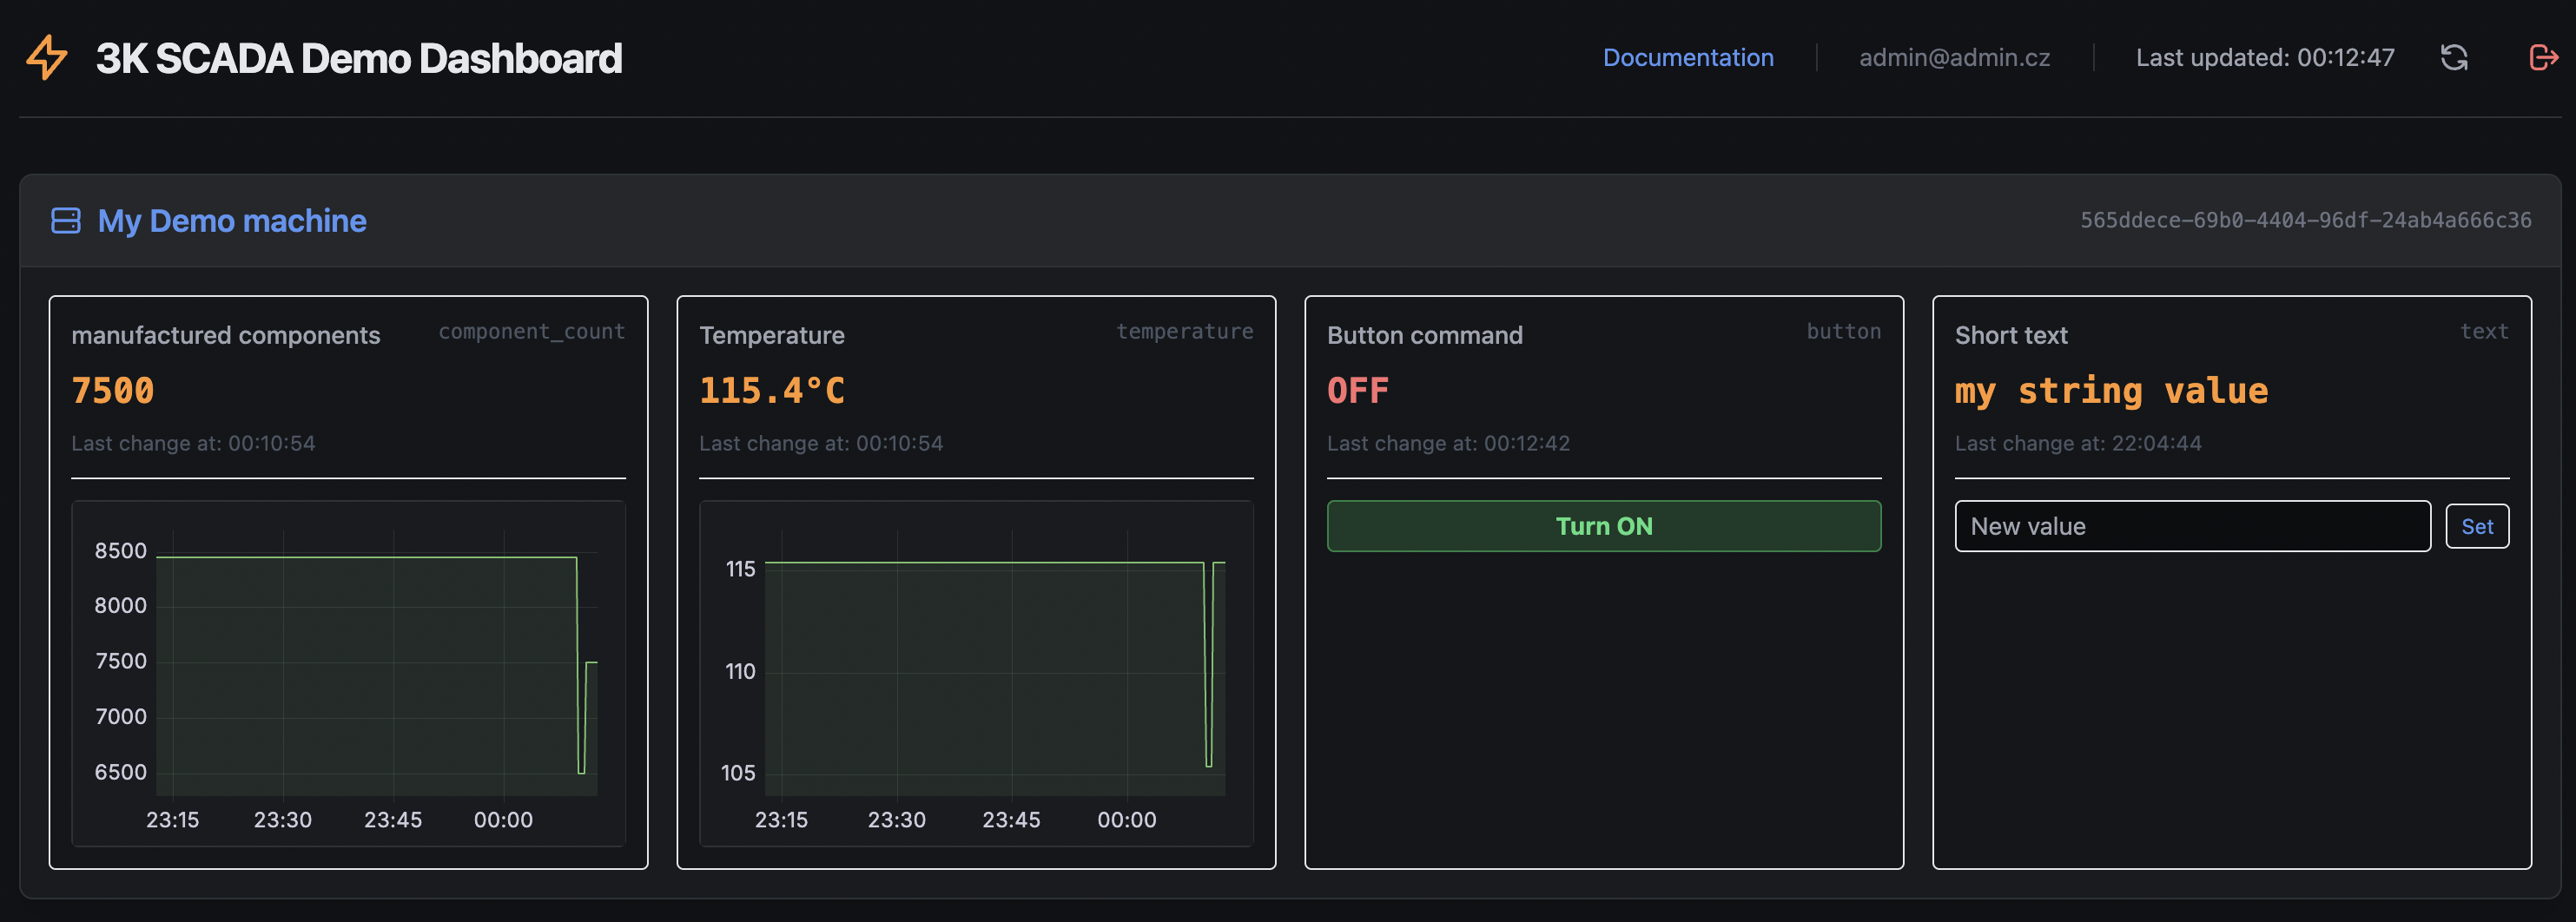
Machine Card
Each machine card contains: - Machine Name and ID: Displayed in the header. - Node List: A grid of all data points associated with the machine.
Node Card
Each node card shows:
- Node Name and ID: Human-readable name and technical identifier.
- Current Value: The last reported value.
- Numeric: Displayed as a number (e.g., 115.4 °C).
- Boolean: Displayed as ON (true) or OFF (false).
- Last Change: Timestamp of the last update.
- Warning: If a value from a machine is invalid, a warning message is displayed here.
- Grafana Chart: A historical trend chart for the last hour.
Machine Status
At the top of each machine card is a color-coded status bar showing the machine's overall state:
- Green — OK: No alarm is active. If the machine has a configured status node, its "OK" message is shown.
- Gray — Stopped: The machine's status node reports that the machine is stopped; its configured "stopped" message is shown.
- Red or Orange — Alarm: One of the machine's configured errors is currently active. The bar shows the alarm's name and severity. The color depends on the severity code: higher-priority alarms (
P1,P2) are shown in red, lower-priority alarms (P3–P5) in orange.
Alarms are configured by an administrator under Admin Panel → Machine Errors: each entry maps a Node and a triggering value (Activation Value) to an error code, name, and severity. While an alarm is active, an Error Event is recorded with its start (and later, end) time; depending on configuration, an alarm can also automatically open and close a maintenance Task — see Maschinenfehler (Alarme) in the Maintenance Guide.
Controlling Nodes
If you are logged in and a node has write permissions (Read-Write or Write-Only), you can change its value.
Numeric/String Nodes
For Integer, Float, Byte, or String types, an input field is available.
- Enter the new value.
- Press
Enteror click the Set button. - The value is sent to the machine.
Boolean Nodes
For Boolean types, toggle buttons are available:
- Turn ON: Appears if the current state is OFF. Click to set the value to
true. - Turn OFF: Appears if the current state is ON. Click to set the value to
false.
If the state is unknown, both buttons are shown.
Computed Nodes
A Computed node doesn't receive its value from a machine. Instead, its value is calculated on the fly from a math formula that combines the values of other nodes.
Configuring a Computed Node
- Go to Admin Panel → Nodes, create (or edit) a node, and set Data Type to
Computed. - Save the node, then open its Current Value section below and enter the formula in the Value field, e.g.:
${motor_temp} + ${offset} - Supported operators are
+,-,*,/, parentheses, and unary minus (-${node}). You can reference any number of other nodes.
Referencing Nodes in a Formula
- Same machine:
${node_id}, e.g.${motor_temp}. - Another machine:
${<machine_uuid>.<node_id>}, e.g.${550e8400-e29b-41d4-a716-446655440000.motor_temp}. The machine's UUID is shown in the Admin Panel. - A Computed node can also reference another Computed node — the formula is evaluated recursively. Circular references (directly or through a chain of nodes) are rejected when you save.
- Only numeric node types (
Integer,Float,Boolean,Byte) can be used as operands; referencing aStringnode raises an error.
Limitations
- Computed nodes are evaluated on demand, each time their value is read. No history is stored for them, so they cannot be exported to Prometheus or charted in Grafana — set Export to Prometheus to off (this is enforced when saving the node).
- A Computed node's value can't be set directly from the dashboard — it's always fully determined by its formula. Set its Access Level to
Read-Onlyso the dashboard doesn't show a write control for it. - If a formula references a node with no value yet, an unknown reference, or divides by zero, the node's Value is shown empty and the reason is shown in its Warning.
- Because incoming values from TCP/S7-connected machines are written directly to a node's value, avoid reusing a Computed node's
node_idin a machine's TCP/S7 mapping — doing so would overwrite its formula.
Authentication
- Public Access: The dashboard is viewable by anyone without logging in.
- Write Access: To change a node's value, you must be logged in. A Login link is available in the top-right corner.
- Logout: If you are logged in, your email and a Logout button will be visible in the header.
Custom Dashboards
Beyond the standard dashboard, Scada3k ships several ready-made dashboard layouts and lets you mount any of them — or a fully bespoke one — at a URL of your choosing.
Built-in Dashboard Views
| Dashboard | Template file | Description |
|---|---|---|
| Standard Dashboard | dashboard.html |
The default view described above: full node detail, write controls, and maintenance tasks. |
| TV Dashboard | tv_dashboard.html |
Read-only, large-screen overview with Panic Mode for alarms (see above). Mounted at /tv/ by default. |
| Management Dashboard | dashboard_management_cz.html |
Collapsible per-machine tiles with alarm and task statistics (last day/week/month) plus a top-5 most frequent errors breakdown per machine. Read-only. Czech language only. |
| Service Dashboard | dashboard_service_cz.html |
Collapsible machine tiles with write controls, plus a combined task list across all machines with a "Close all" shortcut. Czech language only. |
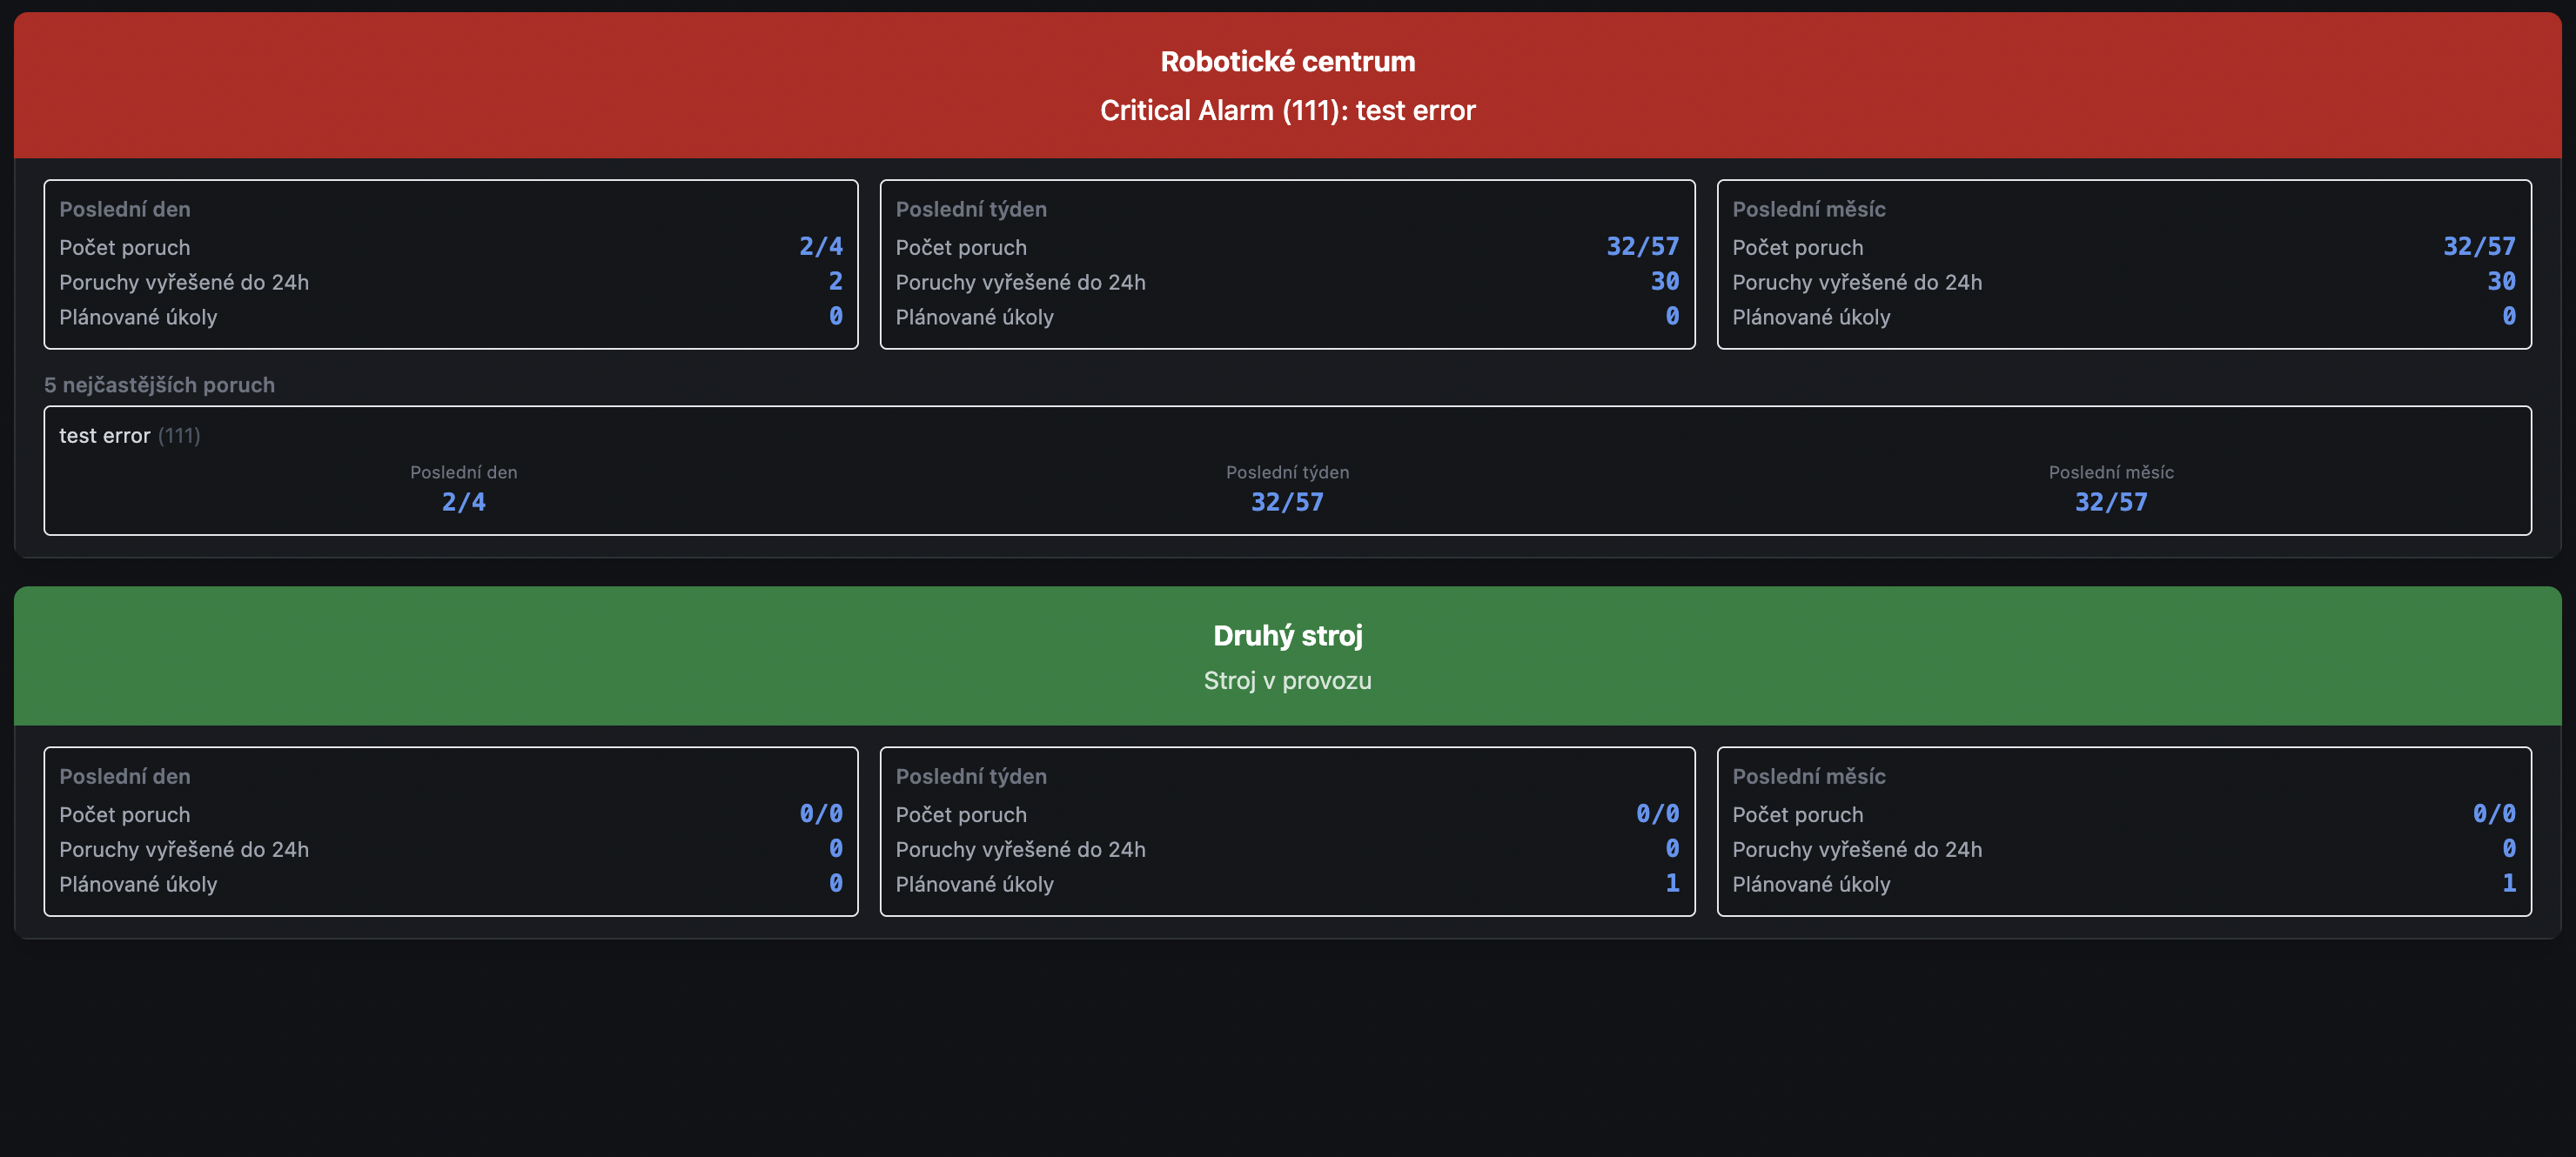
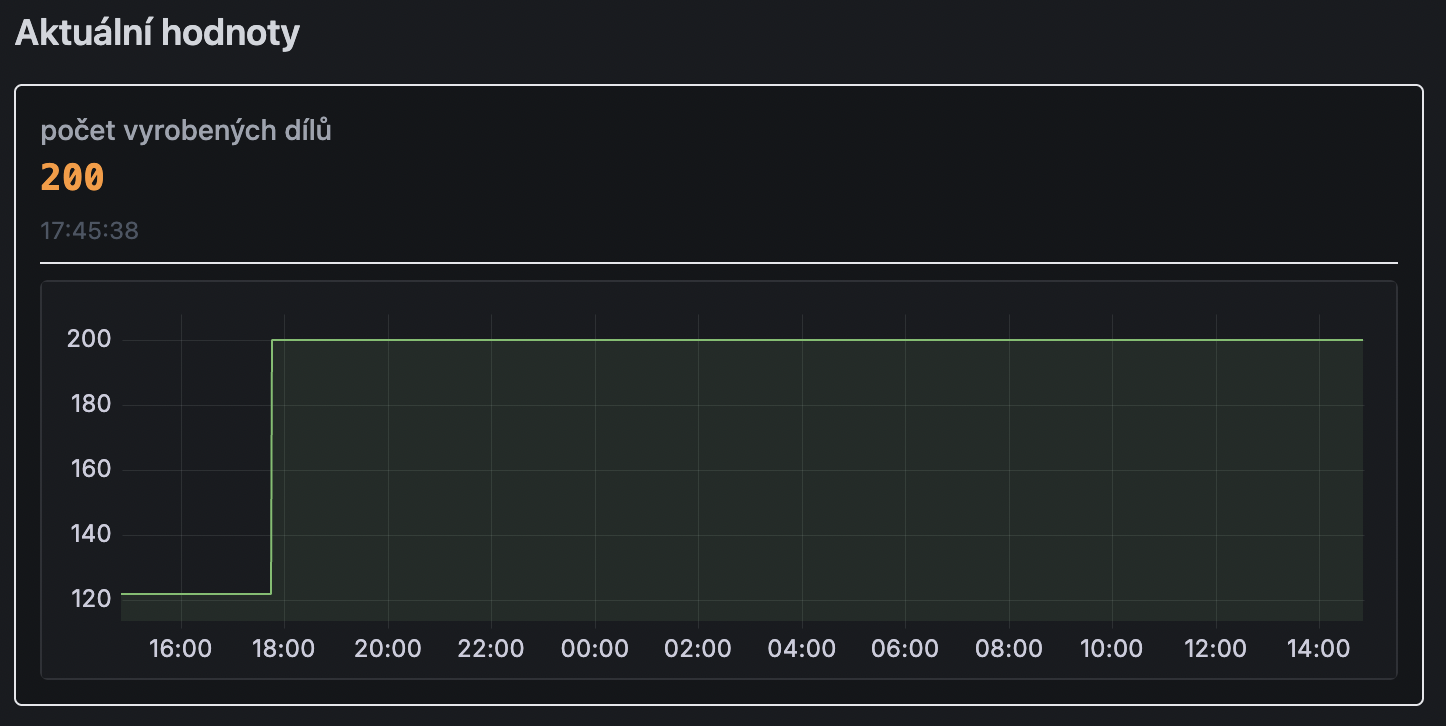 Figure: The Management Dashboard, collapsed per-machine tiles and their expanded node values.
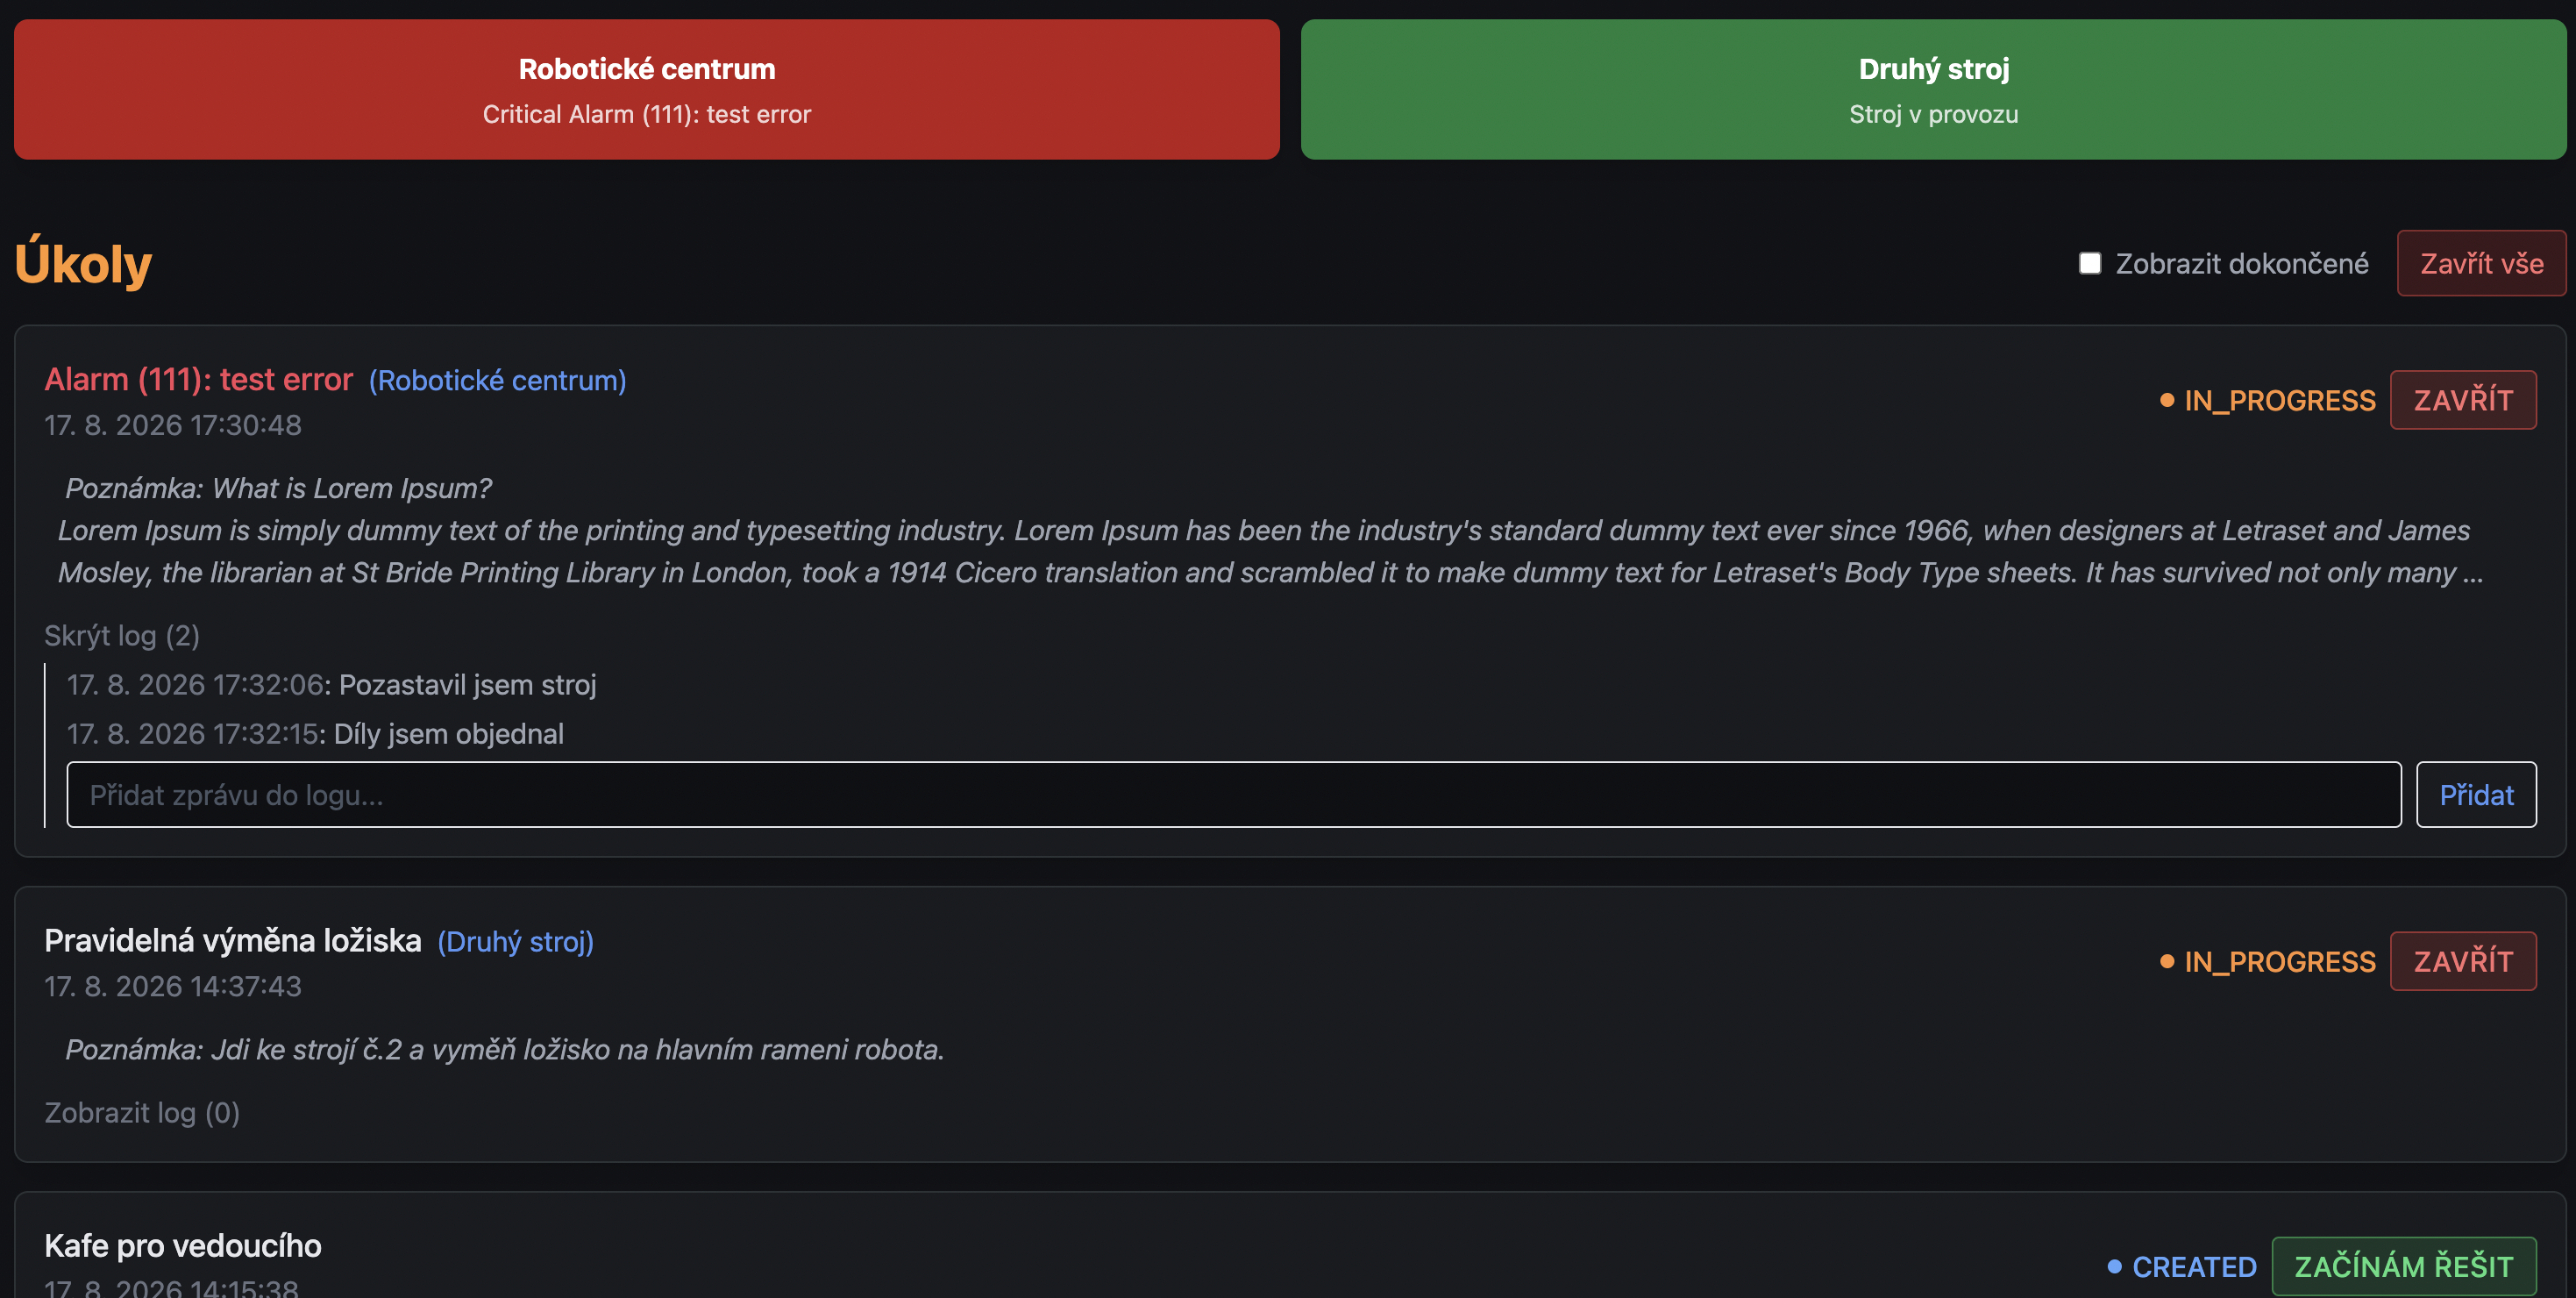
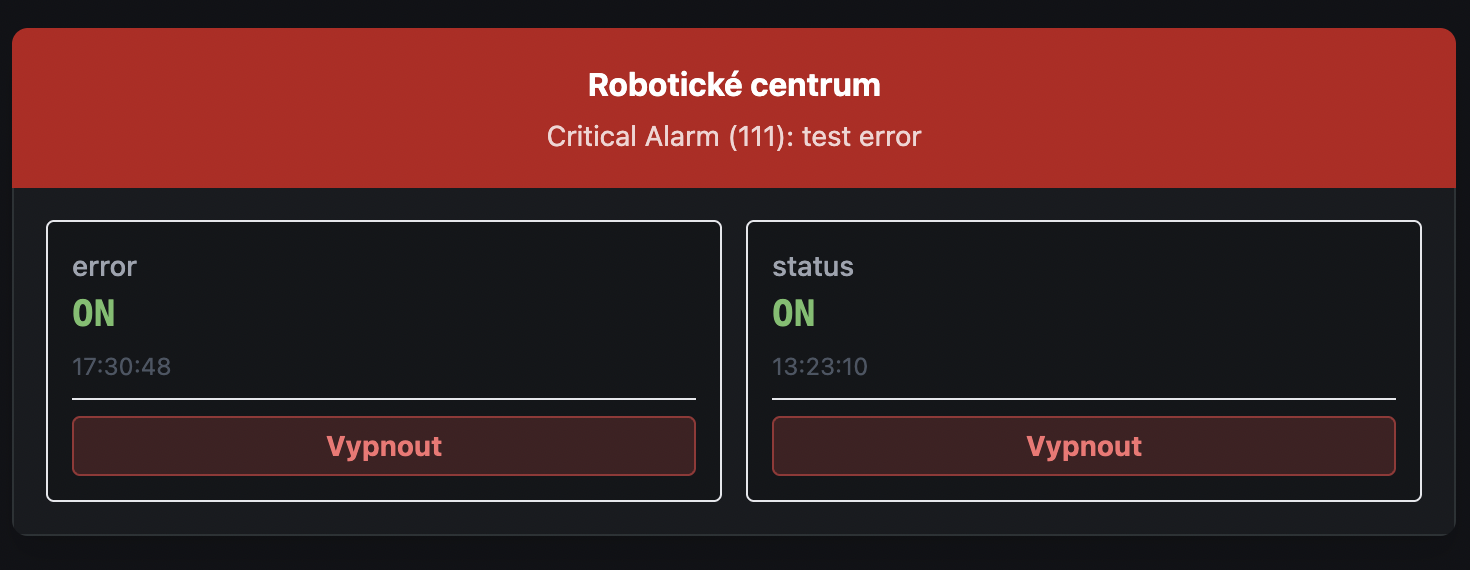 Figure: The Service Dashboard, collapsed per-machine tiles and their expanded node values.
Registering a Dashboard
- Go to Admin Panel → Dashboards.
- Add a new entry and set:
- Name – a display name for your own reference.
- Template – pick one of the templates available on the server (the built-in ones above, or a custom one built for you).
- URL – the slug it will be served at, e.g.
managementmakes the dashboard available athttps://<your-domain>/management/.
- Save. The dashboard is live immediately, no restart required.
The Management and Service dashboards don't include a login link. If you need write access there, log in first via the Standard Dashboard or /login/ in the same browser.
We can also build a fully bespoke dashboard tailored to your operational needs — combined multi-machine views, long-term trend visualizations, custom KPIs and production targets — and add it as a new template you can register the same way.
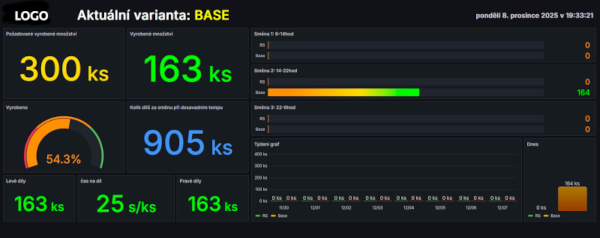
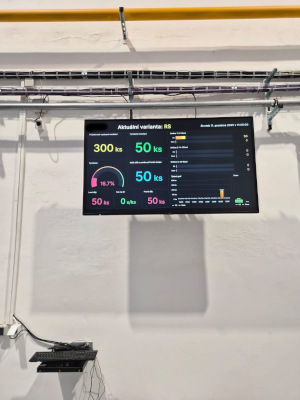 Figure: An example of a custom production monitoring dashboard deployed for a client.